Last Updated on February 29, 2024 by CREW Editorial
Vancouver had a strong sales surge to start the year. Seasonally adjusted home sales in Vancouver surged an estimated 12% m/m and were up 38.5%. This is compared to last January, with particularly strong growth of over 50% for single-family dwellings, with 1,427 homes sold according to the Greater Vancouver Realtors January 2024 Monthly Market Report1.
| Type | Active Listings | Sales | Benchmark Price | Average Days on Market |
|---|---|---|---|---|
| Detached | 3,191 | 379 | $1,942,400 | 54 |
| Attached | 1,247 | 285 | $1,066,700 | 37 |
| Apartment | 3,746 | 746 | $751,900 | 42 |
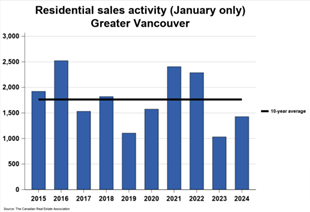
While sales remain relatively subdued compared to historical averages for this time of year, this rise in sales during January can be seen as a positive sign.
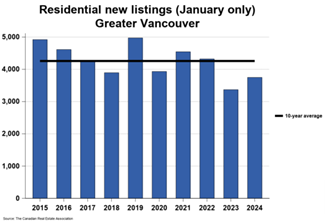
There has also been a rise in new listings of about 14% compared to last year. However, they remain below the typical levels seen over the past decade. In January, the sales-to-new listings ratio remained stable, towards the lower end of the balanced range for Vancouver.
| Property Type | Sales to Active Listings – January 2024 |
|---|---|
| Detached | 11.9% |
| Attached | 22.9% |
| Apartment | 19.9% |
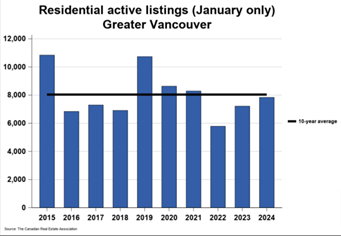
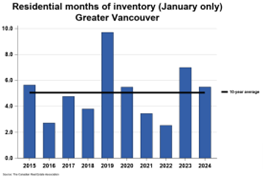
Inventory has increased significantly, by 9.8%, compared to last January. Even after 18 months of lowered sales, overall supply remains at average levels compared to numbers over the past decade.
Affordability remains a concern, though there are signs of improvement. This increase in sales will likely be temporary until affordability constraints, including mortgage rates, prices, and other factors are reduced.
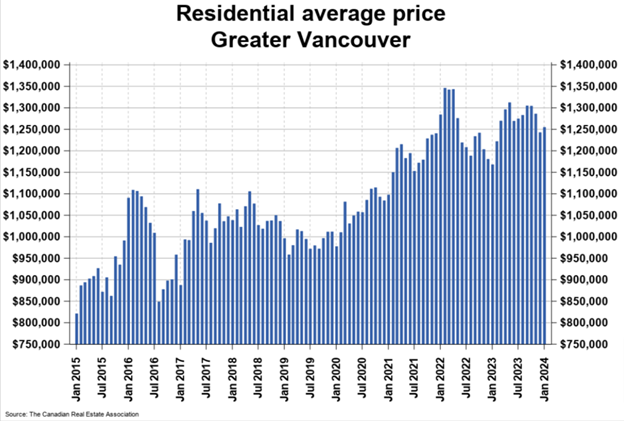
The MLS House Price Index (HPI)2 showed a slight decrease in January, but with the tight supply, this drop may be temporary.
Construction activity for dwellings increased in December, with the number of units being built in Vancouver increasing by 3.2%, primarily driven by a 6.7% increase in rental units and a 2.3% rise in condos, which offset a 4.9% decline in single-family homes. The decline in single-family home construction is expected to worsen in 2024, as the numbers of building permits issued for single dwellings fell.4
CMHC Construction Starts in Vancouver
| Year | Homeowner | Rental | Condo | Co-Op | All |
|---|---|---|---|---|---|
| 2013 | 3,840 | 3,149 | 11,707 | 0 | 18,696 |
| 2014 | 4,354 | 3,286 | 11,542 | 30 | 19,212 |
| 2015 | 4,454 | 3,810 | 12,599 | 0 | 20,863 |
| 2016 | 4,757 | 6,841 | 16,226 | 90 | 27,914 |
| 2017 | 4,566 | 4,591 | 17,047 | 0 | 26,204 |
| 2018 | 4,048 | 6,425 | 12,931 | 0 | 23,404 |
| 2019 | 3,042 | 6,727 | 18,372 | 0 | 28,141 |
| 2020 | 2,940 | 5,707 | 13,697 | 27 | 22,371 |
| 2021 | 3,063 | 6,683 | 16,267 | 0 | 26,013 |
| 2022 | 3,763 | 9,867 | 12,353 | 0 | 25,983 |
| 2023 | 3,195 | 10,768 | 19,281 | 0 | 33,244 |
| Period | Homeowner | Rental | Condo | Co-Op | All |
|---|---|---|---|---|---|
| Dec 2023 | 183 | 1,681 | 1,498 | 0 | 3,362 |
| Jan 2024 | 140 | 760 | 563 | 0 | 1,463 |


