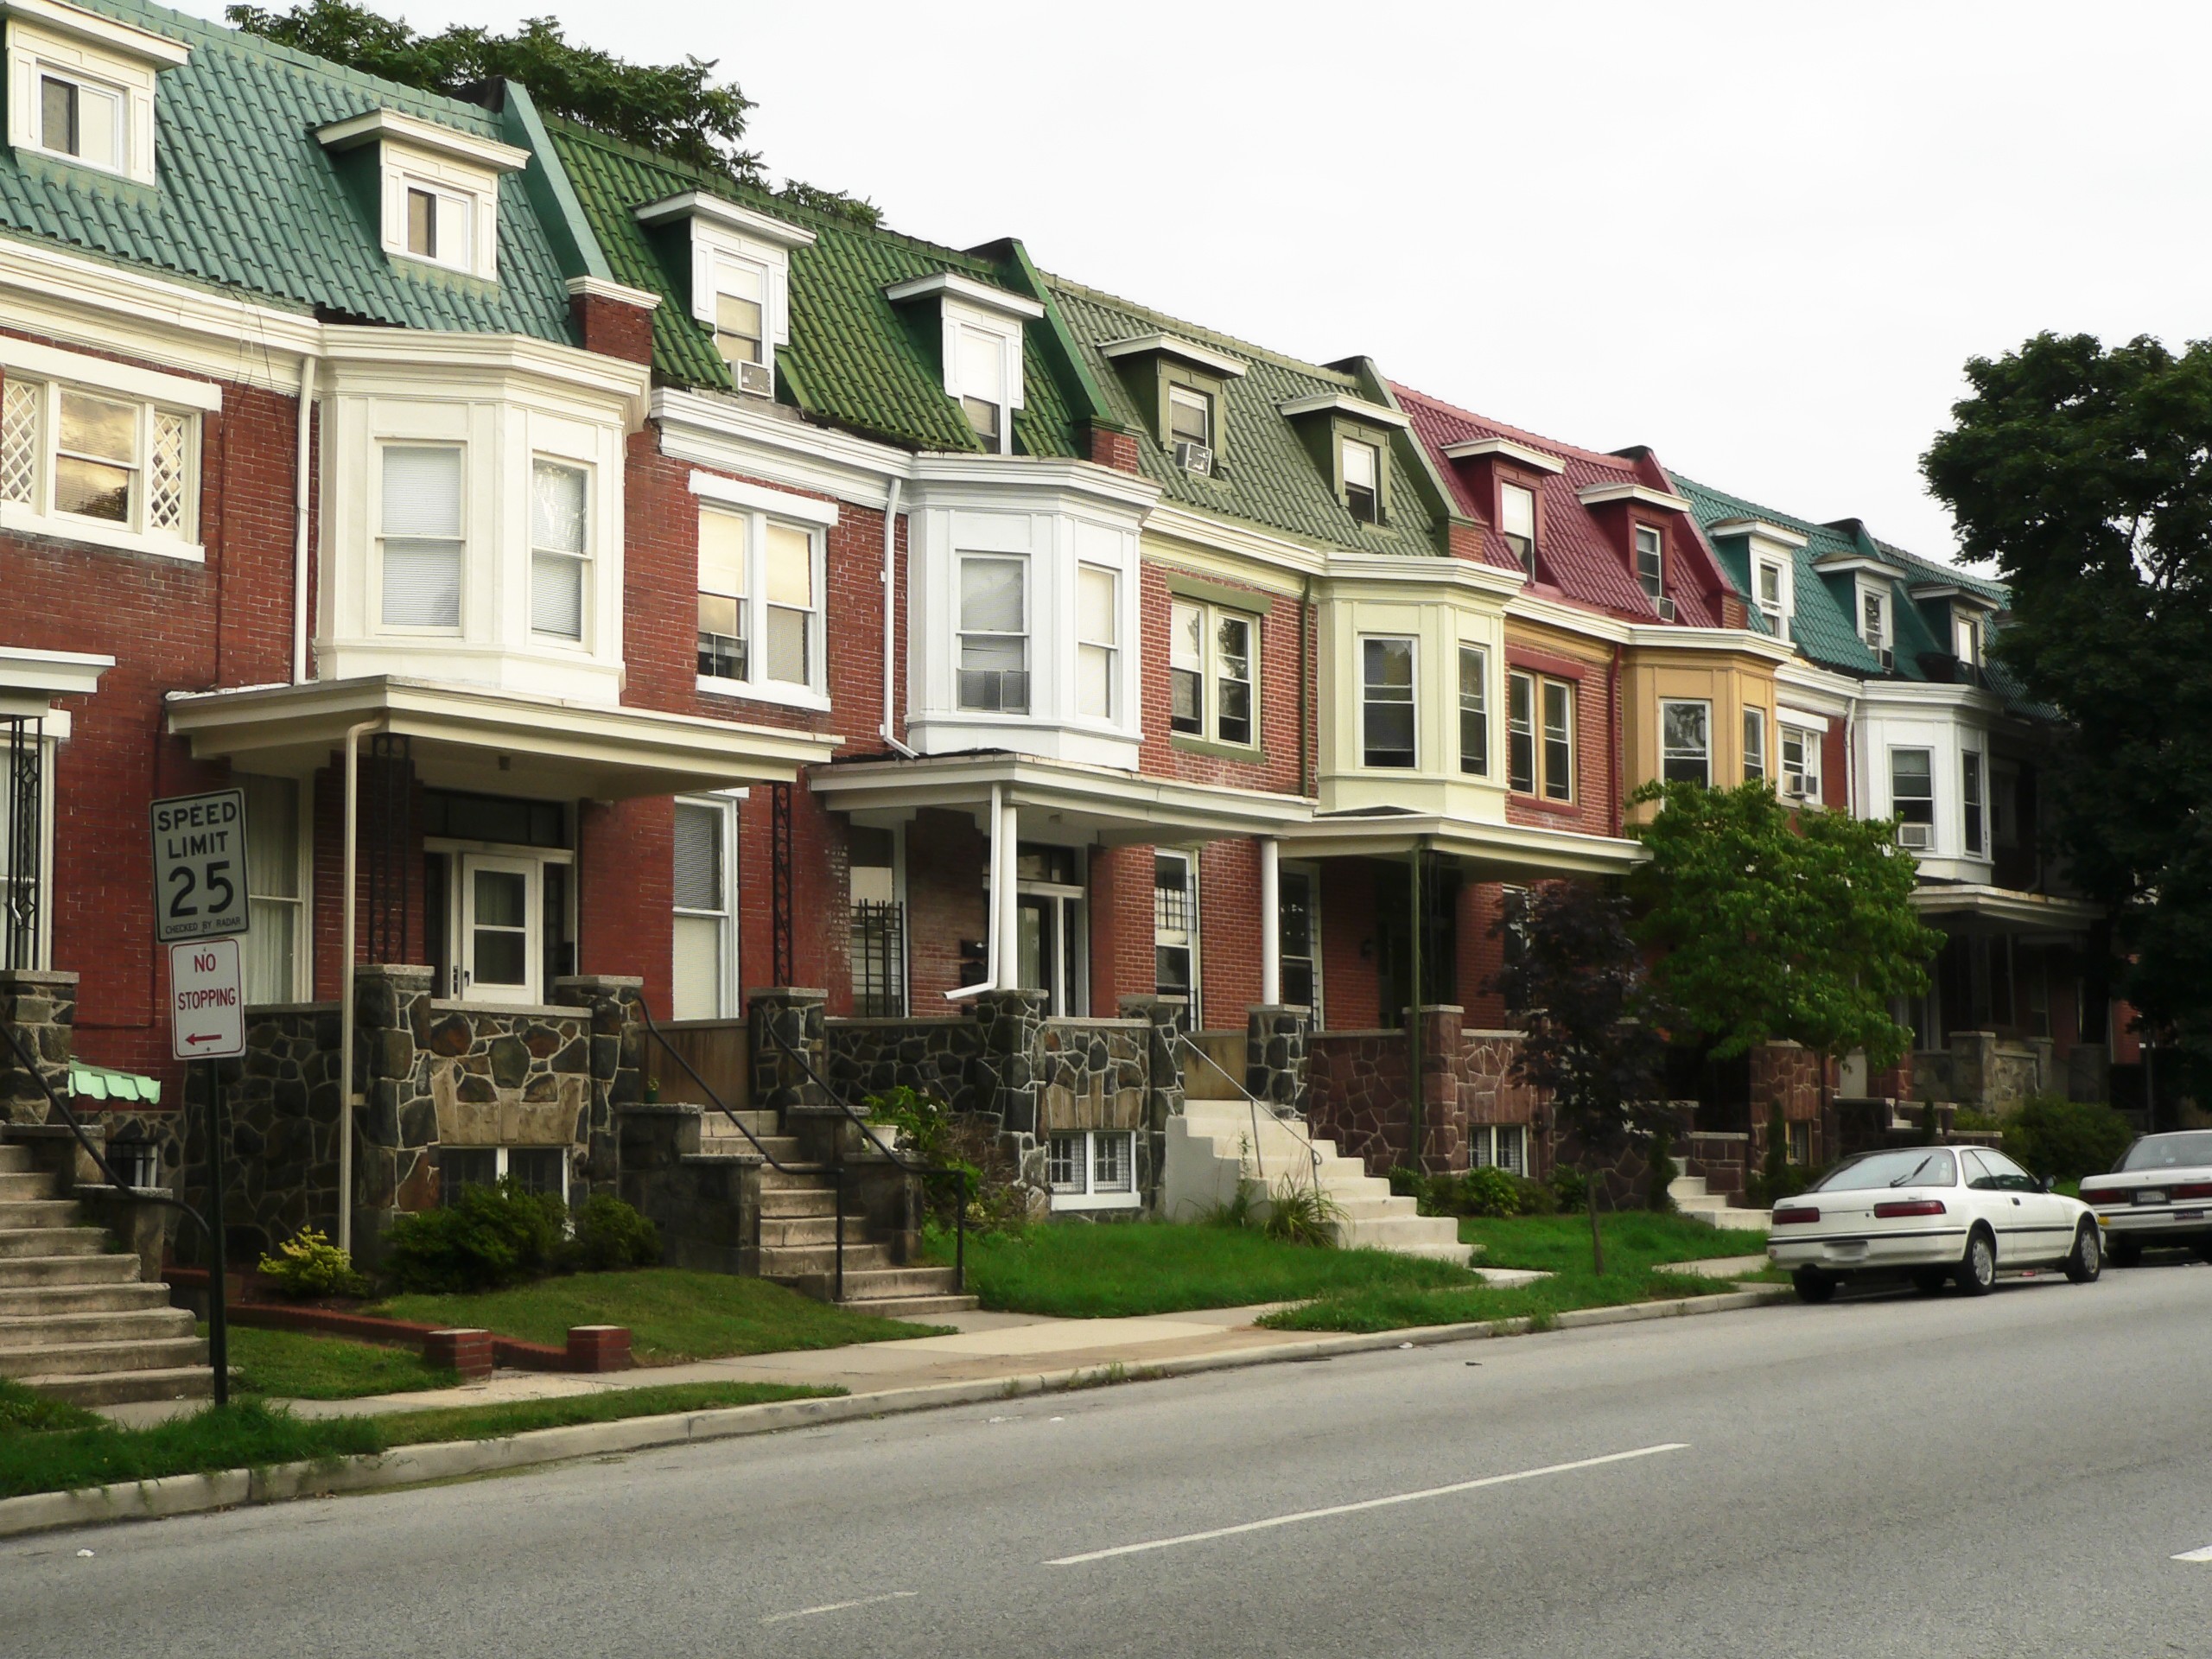
In March 2024, Newfoundland and Labrador’s real estate market experienced mixed trends, with St. John’s seeing increases.
Sales
In March 2024, 310 homes were sold through the MLS® System of the Newfoundland and Labrador Association of REALTORS®, with a 10.9% decrease from March 2023. These sales were 12.3% below the five-year average and 1.3% below the ten-year average for March. Year-to-date home sales totalled 855 units, down by 5% from the same period in 2023.
St. John’s
In St. John’s, residential sales saw an 8.6% increase year-over-year in March, although the rest of the province had a 19.3% decline.
Prices
The MLS® Home Price Index (HPI) provides a more accurate reflection of price trends than average or median price measures. In March 2024, the MLS® HPI composite benchmark price in Newfoundland and Labrador was $290,400, up 6.7% from March 2023. The benchmark price for single-family homes stood at $292,000, with a moderate gain of 6.6% year-over-year. The benchmark apartment price reached $240,600, up by 7.5% from the previous year. For townhouse/row units, the benchmark price was $284,000, with a more significant rise of 10% compared to the previous year.
St. John’s
In March 2024, the overall MLS® HPI composite benchmark price for homes in St. John’s reached $335,000, marking a 7.6% increase from March 2023. The benchmark price for single-family homes in St. John’s was $346,500, showing a moderate gain of 7.7% year-over-year. Comparatively, the benchmark price for townhouse/row units was $284,000, rising by 10% from the previous year, while the benchmark apartment price reached $240,200, reflecting a 7.5% increase from the previous year.
Listings
In March 2024, there were 657 new residential listings. These listings were 10.5% below the five-year average and 16.1% below the ten-year average for March. There were 2,291 active residential listings at the end of March, a 5% decrease from March 2023, for the lowest March levels in over 15 years. Additionally, active listings were 26% below the five-year average and 36.6% below the ten-year average for March.

Inventory
Months of inventory were 7.4 at the end of March 2024, up from 6.9 in March 2023 but below the long-run average of 12.4 for March.
Newfoundland Employment Trends
As of March 2024, Newfoundland and Labrador’s unemployment rate was 10.2%, down slightly by 0.1% from February. This is below long-term averages. In March 2024, there were 1,400 more full-time and 500 more part-time positions, for a total increase of 1,900 jobs. However, full-time employment was still 2,300 jobs below its peak in January 2013. All numbers are seasonally adjusted, three-month moving averages.
Construction Starts
In Q1 2024, in Newfoundland and Labrador, construction started on 104 residential units in March. Among these, 65 were single-family homes, 8 were semi-detached units, 3 were row houses, and 28 were apartments. In Corner Brook specifically, construction commenced on 12 single-family homes. In St. John’s, a total of 92 residential units began construction, including 53 single-family homes, 8 semi-detached units, 3 row houses, and 28 apartments.
Rentals
For St. John’s, median rent was $1,010 in March 2024, for an increase of 10% over March 2023.


